NCAA Indoor Track & Field Championships 2012Mar 8, 2012 by Ben Enowitz
The Enowitz Calculator: Predictions for the Men's Mile at NCAAs
The Enowitz Calculator: Predictions for the Men's Mile at NCAAs
I developed the “Enowitz Calculator” my sophomore year in an applied math course. Essentially, I wanted to find a way to better predict who would win the mile. Is it the runner with the best closing speed? The runner who has the endurance to run the prelims and then not be fatigued for the finals? A variety of factors are incorporated such as:
• Age: freshman, sophomore, junior, senior
• Strength of distance program: measured by XC team ranking
• Strength of track program: measured by current indoor rankings
• Current form: season best time in mile
• Fatigue: did the runner race the DMR the night before?
• Championship experience: the number of times the runner has qualified for nationals in the 1500m or mile
• Speed, endurance, event ability (mile or 1500m PR): Using IAAF tables for numerical ratings of performances. For example a 3:59.99 mile is 1075 points.
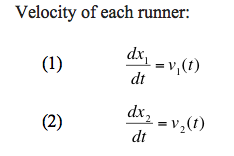
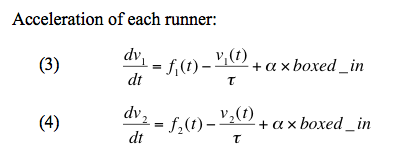
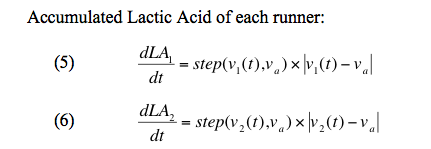
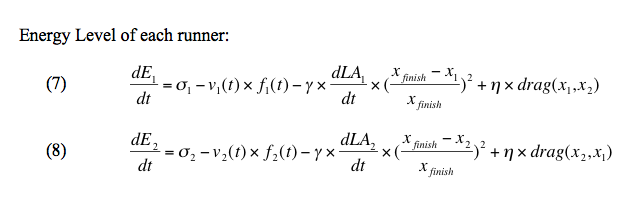
I used data from 2005-2010 and ran a massive regression to develop numerical rankings. I also developed a number of differential equations (based on Joseph Keller’s paper “Optimal Velocity in a Race”) to see how a number of situations would play out to develop a more qualitative opinion.
Here are the differential equations (I can do a follow up article about what each one of these means):
![]()
Here are the predictions using the Enowitz Calculator for the mile. I put some comments by each guy's name, but the rating next to the name is the purely mathematical formulation:
• Note: this assumes that all runners make the final i.e this is NOT a prediction for preliminary rounds. For example, I take into account that some runners are better at running rounds. So even though Peter Callahan could be a big threat to make the final, he might not make it out of the prelims (or if he does make it the final, he might suffer from not being fresh). Assuming he makes it out of the rounds, he is predicted to get 9th. Moreover, there are certain runners who might perform better in a prelim round (which might be slower paced) then in the final.
• Miles Batty has the highest rating in the last 8 years according to the Enowitz Calculator.
• This is the deepest and one of the most experience fields in the last 8 years. Most years the runner who wins has a rating around 10. This year there are 5 runners with ratings over 10.
Rankings:
1. Miles Batty (13.53, seed #1: 3:54.54 ) -- rare combination of a very fast 800m time, championship experience, strong 3k, comes from a good XC background, etc.
2. Cory Leslie (12.02, seed #5: 3:56.85) -- big darkhorse, but I think the Enowitz Calculator is correct in putting him this high.
3. David McCarthy (10.83 seed #2: 3:55.75) -- he has the strength to be fresh for the finals and the kick to make an impact.
4. Chris O'Hare (10.48, seed #4: 3:56.63) -- 2:20 1k and 3:56 miler. Another guy who most years would be considered a favorite.
5. Erik van Ingen (10.35, seed #3: 3:56.37) – Enowitz Calculator loves experienced runners and he also has shown that his current form is excellent. Above average strength and decent speed, but nothing that indicates he can be top 3. However, I wouldn’t be surprised if he sneaks in there because of his experience.
6. Andrew Bayer (9.25, seed #8: 3:58.23) -- I am surprised the Enowitz Calculator doesn't have him higher. It could be because he hasn't indicated that he can really pop a good 800, but Bayer has run 7:48. Most years this guy would be contending for the title.
7. Rich Peters (8.79, seed #6: 3:57.83) --- My personal belief is that he will be in the top 3. He ran his 3:57 mile at Valentine closing in 55 low. However will he have a kick after running a fast prelim the day prior?
8. Robby Creese (8.70, seed #13: 3:58.94 ) -- Freshman typically excel at NCAA. Historically they have the highest average place (there are fewer of them, but when they make it to the big show they typically do well).
9. Peter Callahan (8.02, seed #10: 3:58.76) -- Similar to Rich Peters. He lacks strength, but could be a threat if he is fresh and feeling good in the finals.
10. Raul Botezan (7.57, seed #12: 3:58.94) -- Has one of the slower miler PBs in the field. He does have a 1:49.22 to his name so he could surprise.
11. Kirubel Erassa (7.17, seed #11: 3:58.84) -- comes from strong XC program which historically, is a strong indicator that he could be a darkhorse.
12. Nick Happe (6.79, seed #9: 3:58.73) -- Good strength runner, the Enowitz Calculator is not convinced he can be a threat in a kicker's race.
13. Sam McEntee (6.08, seed #7: 3:57.86) -- Most years this guy would be right up there (3:57.86)...just too many good guys this year. However, the Enowitz Calculator was uncertain about this guy. He could finish as high as top 5.
14. Eric Harasyn (5.68, seed #14: 3:58.99) -- He is scheduled to run the 1200 of the DMR which is rare for guys entered into the mile. 3 races in 2 days could be potentially overwhelming.
15. Matt Maldonado (5.66, seed #15: 3:59.08) -- slowest mile PB in the field. Will take a huge effort to make the final.
• Age: freshman, sophomore, junior, senior
• Strength of distance program: measured by XC team ranking
• Strength of track program: measured by current indoor rankings
• Current form: season best time in mile
• Fatigue: did the runner race the DMR the night before?
• Championship experience: the number of times the runner has qualified for nationals in the 1500m or mile
• Speed, endurance, event ability (mile or 1500m PR): Using IAAF tables for numerical ratings of performances. For example a 3:59.99 mile is 1075 points.
I used data from 2005-2010 and ran a massive regression to develop numerical rankings. I also developed a number of differential equations (based on Joseph Keller’s paper “Optimal Velocity in a Race”) to see how a number of situations would play out to develop a more qualitative opinion.
Here are the differential equations (I can do a follow up article about what each one of these means):
Here are the predictions using the Enowitz Calculator for the mile. I put some comments by each guy's name, but the rating next to the name is the purely mathematical formulation:
• Note: this assumes that all runners make the final i.e this is NOT a prediction for preliminary rounds. For example, I take into account that some runners are better at running rounds. So even though Peter Callahan could be a big threat to make the final, he might not make it out of the prelims (or if he does make it the final, he might suffer from not being fresh). Assuming he makes it out of the rounds, he is predicted to get 9th. Moreover, there are certain runners who might perform better in a prelim round (which might be slower paced) then in the final.
• Miles Batty has the highest rating in the last 8 years according to the Enowitz Calculator.
• This is the deepest and one of the most experience fields in the last 8 years. Most years the runner who wins has a rating around 10. This year there are 5 runners with ratings over 10.
Rankings:
1. Miles Batty (13.53, seed #1: 3:54.54 ) -- rare combination of a very fast 800m time, championship experience, strong 3k, comes from a good XC background, etc.
2. Cory Leslie (12.02, seed #5: 3:56.85) -- big darkhorse, but I think the Enowitz Calculator is correct in putting him this high.
3. David McCarthy (10.83 seed #2: 3:55.75) -- he has the strength to be fresh for the finals and the kick to make an impact.
4. Chris O'Hare (10.48, seed #4: 3:56.63) -- 2:20 1k and 3:56 miler. Another guy who most years would be considered a favorite.
5. Erik van Ingen (10.35, seed #3: 3:56.37) – Enowitz Calculator loves experienced runners and he also has shown that his current form is excellent. Above average strength and decent speed, but nothing that indicates he can be top 3. However, I wouldn’t be surprised if he sneaks in there because of his experience.
6. Andrew Bayer (9.25, seed #8: 3:58.23) -- I am surprised the Enowitz Calculator doesn't have him higher. It could be because he hasn't indicated that he can really pop a good 800, but Bayer has run 7:48. Most years this guy would be contending for the title.
7. Rich Peters (8.79, seed #6: 3:57.83) --- My personal belief is that he will be in the top 3. He ran his 3:57 mile at Valentine closing in 55 low. However will he have a kick after running a fast prelim the day prior?
8. Robby Creese (8.70, seed #13: 3:58.94 ) -- Freshman typically excel at NCAA. Historically they have the highest average place (there are fewer of them, but when they make it to the big show they typically do well).
9. Peter Callahan (8.02, seed #10: 3:58.76) -- Similar to Rich Peters. He lacks strength, but could be a threat if he is fresh and feeling good in the finals.
10. Raul Botezan (7.57, seed #12: 3:58.94) -- Has one of the slower miler PBs in the field. He does have a 1:49.22 to his name so he could surprise.
11. Kirubel Erassa (7.17, seed #11: 3:58.84) -- comes from strong XC program which historically, is a strong indicator that he could be a darkhorse.
12. Nick Happe (6.79, seed #9: 3:58.73) -- Good strength runner, the Enowitz Calculator is not convinced he can be a threat in a kicker's race.
13. Sam McEntee (6.08, seed #7: 3:57.86) -- Most years this guy would be right up there (3:57.86)...just too many good guys this year. However, the Enowitz Calculator was uncertain about this guy. He could finish as high as top 5.
14. Eric Harasyn (5.68, seed #14: 3:58.99) -- He is scheduled to run the 1200 of the DMR which is rare for guys entered into the mile. 3 races in 2 days could be potentially overwhelming.
15. Matt Maldonado (5.66, seed #15: 3:59.08) -- slowest mile PB in the field. Will take a huge effort to make the final.