
For the latest updates follow our LIVE TEAM PROJECTIONS updating after every prelim/final
You want to know who will win the men’s NCAA team title? (Women's Release)
We’ll tell you right now!
The Process:
- Ranked the top 8 athlete’s PBs (indoors/outdoors combined)
- Converted all altitude marks
- Converted indoor flat track marks
- Ignored wind-aided marks
- Included marks done unattached, out of season, or for another school/high school/club
- For 4x4 relays used best 2015 team mark
- Ranked the top 8 athlete’s PBs (indoors/outdoors combined)
- Converted all altitude marks
- Converted indoor flat track marks
- Ignored wind-aided marks
- Included marks done unattached, out of season, or for another school/high school/club
- For 4x4 relays used best 2015 team mark
- For DMRs projected the anchor leg each team will enter and ranked the team’s based on the anchor’s 1500/mile PB
Before You Cry Wolf:
Of course the results of the 2015 championships will not be the exact order of all the athlete’s PBs. Some events athletes will over achieve and in other events the athletes will under achieve. The purpose of using PBs is to find an average to work off of that will result in seeing the true potential of each team’s scoring depth. This exercise is all about discovering the teams with the best scoring potential, it is not about predicting the outcome of specific races.
Of course the results of the 2015 championships will not be the exact order of all the athlete’s PBs. Some events athletes will over achieve and in other events the athletes will under achieve. The purpose of using PBs is to find an average to work off of that will result in seeing the true potential of each team’s scoring depth. This exercise is all about discovering the teams with the best scoring potential, it is not about predicting the outcome of specific races.
Why not just score the meet using 2015 marks?
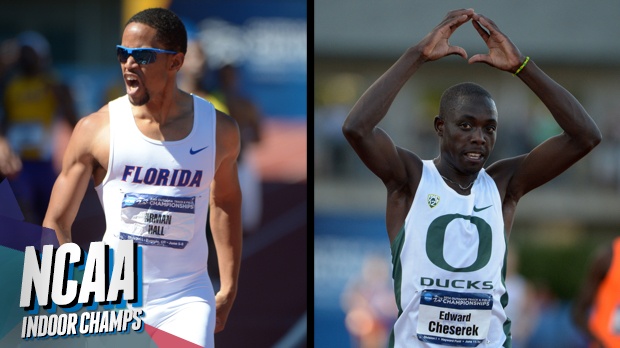
Elite athletes are notorious for running the regular season just to qualify. Most of the time we never see athletes show their true potential until championship meets. For example, Oregon’s Edward Cheserek ran 7:49 in the 3k early this season. Since running the 3k 5 people have run faster than him. However, there is no need for Cheserek to re-run the 3k just to be ranked higher. For athletes, a time that is 1st or 16th is the same. 2015 marks don’t do a good job of representing athlete’s true potential.
NOTE: This process was used during the 2014 indoor/outdoor championship team projections and was very successful.
Men’s Top 10 Projected Team Scores (Pre-Meet):
01) 69.5 Florida
02) 65.0 Oregon
03) 43.0 Arkansas
04) 40.0 Texas A&M
05) 23.0 Georgia
06) 20.5 LSU
07) 20.0 Oklahoma State
08) 19.6 Nebraska
09) 18.6 Texas Tech
10) 16.0 Penn State
10) 16.0 Virginia Tech
01) 69.5 Florida
02) 65.0 Oregon
03) 43.0 Arkansas
04) 40.0 Texas A&M
05) 23.0 Georgia
06) 20.5 LSU
07) 20.0 Oklahoma State
08) 19.6 Nebraska
09) 18.6 Texas Tech
10) 16.0 Penn State
10) 16.0 Virginia Tech
Again reminder these are not our predictions for individual events just a tool to calculate a team score projection.
| 60 | John Teeters | JR | Oklahoma State | 6.52 | 10.00 |
| 60 | Trayvon Bromell | SO | Baylor | 6.54 | 8.00 |
| 60 | Jalen Miller | SO | Mississippi | 6.55 | 6.00 |
| 60 | Tevin Hester | JR | Clemson | 6.56 | 4.00 |
| 60 | Kendal Williams | FR | Florida State | 6.56 | 4.00 |
| 60 | Cameron Burrell | SO | Houston | 6.56 | 4.00 |
| 60 | Markesh Woodson | JR | Missouri | 6.58 | 1.00 |
| 60 | Ronnie Baker | JR | TCU | 6.58 | 1.00 |
| 60 | Christian Coleman | FR | Tennessee | 6.58 | 1.00 |
| 200 | Dedric Dukes | SR | Florida | 19.97 | 10.00 |
| 200 | Aaron Ernest | SR | LSU | 20.14 | 8.00 |
| 200 | Trentavis Friday | FR | Florida State | 20.33 | 6.00 |
| 200 | Shavez Hart | SR | Texas A&M | 20.35 | 5.00 |
| 200 | Andre De Grasse | JR | USC | 20.38 | 4.00 |
| 200 | Brendon Rodney | JR | LIU Brooklyn | 20.41 | 3.00 |
| 200 | Ncincilili Titi | FR | South Carolina | 20.48 | 1.50 |
| 200 | Bryce Robinson | JR | Tulsa | 20.48 | 1.50 |
| 400 | Deon Lendore | SR | Texas A&M | 44.36 | 10.00 |
| 400 | Arman Hall | JR | Florida | 44.82 | 8.00 |
| 400 | Vernon Norwood | SR | LSU | 45.02 | 6.00 |
| 400 | Bralon Taplin | SR | Texas A&M | 45.18 | 5.00 |
| 400 | Hugh Graham, Jr | SR | Florida | 45.19 | 4.00 |
| 400 | Najee Glass | JR | Florida | 45.34 | 3.00 |
| 400 | Michael Cherry | SO | Florida State | 45.37 | 2.00 |
| 400 | Christopher Giesting | SR | Notre Dame | 45.53 | 1.00 |
| 800 | Brandon McBride | JR | Miss State | 1:45.35 | 10.00 |
| 800 | Edward Kemboi | SR | Iowa State | 1:45.98 | 8.00 |
| 800 | Ryan Schnulle | JR | Florida | 1:46.29 | 6.00 |
| 800 | Andres Arroyo | SO | Florida | 1:46.78 | 5.00 |
| 800 | Dylan Capwell | SO | Monmouth | 1:46.82 | 4.00 |
| 800 | Alex Amankwah | JR | Alabama | 1:46.86 | 3.00 |
| 800 | Jesse Garn | SR | Binghamton | 1:46.98 | 2.00 |
| 800 | Tre'tez Kinnaird | SO | Indiana | 1:47.13 | 1.00 |
| 1609 | Edward Cheserek | SO | Oregon | 3:53.60 | 10.00 |
| 1609 | Cristian Soratos | SR | Montana State | 3:55.27 | 8.00 |
| 1609 | Anthony Rotich | SR | UTEP | 3:55.86 | 6.00 |
| 1609 | Brannon Kidder | JR | Penn State | 3:56.11 | 5.00 |
| 1609 | Sam Penzenstadler | SR | Loyola (Ill.) | 3:57.13 | 4.00 |
| 1609 | Julian Oakley | JR | Providence | 3:57.22 | 3.00 |
| 1609 | Patrick Joseph | FR | Virginia Tech | 3:57.44 | 1.50 |
| 1609 | Chad Noelle | JR | Oklahoma State | 3:57.44 | 1.50 |
| 3000 | Eric Jenkins | SR | Oregon | 7:44.91 | 10.00 |
| 3000 | Will Geoghegan | SR | Oregon | 7:45.71 | 8.00 |
| 3000 | Kemoy Campbell | SR | Arkansas | 7:46.95 | 6.00 |
| 3000 | Edward Cheserek | SO | Oregon | 7:47.20 | 5.00 |
| 3000 | Jeramy Elkaim | JR | Oregon | 7:48.48 | 4.00 |
| 3000 | Colby Gilbert | FR | Washington | 7:49.25 | 3.00 |
| 3000 | Stanley Kebenei | SR | Arkansas | 7:49.74 | 2.00 |
| 3000 | Robby Creese | SR | Penn State | 7:50.36 | 1.00 |
| 5000 | Eric Jenkins | SR | Oregon | 13:18.57 | 10.00 |
| 5000 | Parker Stinson | SR | Oregon | 13:28.46 | 8.00 |
| 5000 | Kemoy Campbell | SR | Arkansas | 13:32.82 | 6.00 |
| 5000 | Thomas Curtin | JR | Virginia Tech | 13:38.56 | 5.00 |
| 5000 | Morgan Pearson | JR | Colorado | 13:38.92 | 4.00 |
| 5000 | Pierce Murphy | JR | Colorado | 13:39.29 | 3.00 |
| 5000 | Craig Lutz | JR | Texas | 13:40.30 | 2.00 |
| 5000 | Mark Parrish | SR | Florida | 13:41.87 | 1.00 |
| 4x4 | - | - | Texas A&M | 3:03.23 | 10.00 |
| 4x4 | - | - | Florida | 3:04.22 | 8.00 |
| 4x4 | - | - | LSU | 3:04.28 | 6.00 |
| 4x4 | - | - | Nebraska | 3:06.02 | 5.00 |
| 4x4 | - | - | Alabama | 3:06.05 | 3.50 |
| 4x4 | - | - | TCU | 3:06.05 | 3.50 |
| 4x4 | - | - | Texas | 3:06.76 | 2.00 |
| 4x4 | - | - | Arkansas | 3:06.98 | 1.00 |
| 60H | Omar McLeod | SO | Arkansas | 7.49 | 10.00 |
| 60H | Oladapo Akinmoladun | JR | Nebraska | 7.61 | 8.00 |
| 60H | Donovan Robertson | SO | Ohio State | 7.65 | 6.00 |
| 60H | Chris Caldwell | JR | Texas Tech | 7.68 | 5.00 |
| 60H | Isaac Williams | JR | Houston | 7.72 | 3.00 |
| 60H | Sebastian Barth | SR | No. Iowa | 7.72 | 3.00 |
| 60H | Dondre Echols | JR | South Carolina | 7.72 | 3.00 |
| 60H | William Taylor | SR | Arizona State | 7.73 | 0.50 |
| 60H | Joshua Thompson | SR | LSU | 7.73 | 0.50 |
| DMR | Edward Cheserek | - | Oregon | 3:53.60 | 10.00 |
| DMR | Jordan Williamsz | - | Villanova | 3:53.86 | 8.00 |
| DMR | Robby Creese | - | Penn State | 3:57.11 | 6.00 |
| DMR | Patrick Joseph | - | Virginia Tech | 3:57.44 | 4.50 |
| DMR | Chad Noelle | - | Oklahoma State | 3:57.44 | 4.50 |
| DMR | Amos Bartelsmeyer | - | Georgetown | 3:58.45 | 3.00 |
| DMR | Sean McGorty | - | Stanford | 3:59.34 | 2.00 |
| DMR | Nate McClafferty | - | Duke | 3:59.95 | 1.00 |
| HEP | Maicel Uibo | JR | Georgia | 6044 | 10.00 |
| HEP | Garrett Scantling | JR | Georgia | 6036 | 8.00 |
| HEP | Mike Morgan | JR | Buffalo | 5797 | 6.00 |
| HEP | Luca Wieland | SO | Minnesota | 5787 | 5.00 |
| HEP | Scott Filip | SO | Rice | 5785 | 4.00 |
| HEP | Marcus Nilsson | SR | UCLA | 5760 | 3.00 |
| HEP | Tim Ehrhardt | SO | Michigan State | 5741 | 2.00 |
| HEP | Wolf Mahler | SO | Texas | 5717 | 1.00 |
| HJ | Bryan McBride | SR | Arizona State | 2.28m | 6.60 |
| HJ | Christoff Bryan | FR | Kansas State | 2.28m | 6.60 |
| HJ | Wally Ellenson | SO | Marquette | 2.28m | 6.60 |
| HJ | James White | SR | Nebraska | 2.28m | 6.60 |
| HJ | Jacorian Duffield | SR | Texas Tech | 2.28m | 6.60 |
| HJ | Bradley Adkins | JR | Texas Tech | 2.25m | 3.00 |
| HJ | DJ Smith | SR | Auburn | 2.24m | 1.00 |
| HJ | Avion Jones | JR | E. Carolina | 2.24m | 1.00 |
| HJ | Deante Kemper | SR | No. Arizona | 2.24m | 1.00 |
| LJ | Jarrion Lawson | JR | Arkansas | 8.39m | 10.00 |
| LJ | Marquis Dendy | SR | Florida | 8.28m | 8.00 |
| LJ | Roelf Pienaar | SO | Arkansas State | 7.97m | 6.00 |
| LJ | Jonathan Addison | JR | NC State | 7.88m | 5.00 |
| LJ | Aaron George | SO | Texas State | 7.87m | 4.00 |
| LJ | Keniel Grant | SO | Texas Tech | 7.86m | 3.00 |
| LJ | Cameron Hudson | JR | Alabama | 7.84m | 1.50 |
| LJ | KeAndre Bates | FR | Florida | 7.84m | 1.50 |
| PV | Shawn Barber | JR | Akron | 5.90m | 10.00 |
| PV | Andrew Irwin | SR | Arkansas | 5.75m | 8.00 |
| PV | Jake Blankenship | JR | Tennessee | 5.70m | 6.00 |
| PV | Michael Woepse | SR | UCLA | 5.62m | 5.00 |
| PV | Jax Thoirs | JR | Washington | 5.61m | 4.00 |
| PV | Chris Pillow | SR | Rice | 5.60m | 3.00 |
| PV | Chase Wolfle | JR | Texas A&M | 5.56m | 2.00 |
| PV | Joey Uhle | SR | Air Force | 5.55m | 1.00 |
| SP | Ryan Crouser | JR | Texas | 21.39m | 10.00 |
| SP | Stephen Mozia | SR | Cornell | 20.79m | 8.00 |
| SP | Jonathan Jones | SR | Buffalo | 20.75m | 6.00 |
| SP | Stipe Zunic | SR | Florida | 20.68m | 5.00 |
| SP | Darrell Hill | SR | Penn State | 20.57m | 4.00 |
| SP | Nick Vena | SR | Georgia | 20.39m | 3.00 |
| SP | Ashinia Miller | JR | Georgia | 20.31m | 2.00 |
| SP | Kole Weldon | SR | Texas Tech | 20.11m | 1.00 |
| TJ | Marquis Dendy | SR | Florida | 17.23m | 10.00 |
| TJ | Latario Collie | JR | Texas A&M | 16.91m | 8.00 |
| TJ | Donald Scott | SR | E. Michigan | 16.70m | 6.00 |
| TJ | Manuel Ziegler | SR | Virginia Tech | 16.61m | 5.00 |
| TJ | Ben Williams | JR | Louisville | 16.55m | 4.00 |
| TJ | Jonathan Gardner | SR | Georgia Tech | 16.45m | 3.00 |
| TJ | Matthew Oneal | JR | South Florida | 16.43m | 2.00 |
| TJ | Phillip Young | SR | Mississippi | 16.30m | 1.00 |
| WT | Michael Lihrman | SR | Wisconsin | 25.58m | 10.00 |
| WT | Chuk Enekwechi | JR | Purdue | 24.39m | 8.00 |
| WT | Conor McCullough | SR | USC | 23.60m | 6.00 |
| WT | Cameron Brown | JR | Tennessee | 23.38m | 5.00 |
| WT | Nick Miller | SR | Oklahoma State | 23.07m | 4.00 |
| WT | Jordan Young | SO | Virginia | 22.92m | 3.00 |
| WT | Matthias Tayala | JR | Kent State | 22.90m | 2.00 |
| WT | Antonio James | SR | Michigan State | 22.74m | 1.00 |