NCAA D1 Outdoor ChampionshipsJun 9, 2015 by Taylor Dutch
Who is the Steph Curry of Track and Field?
Who is the Steph Curry of Track and Field?

Efficiency as a Means for Performance Evaluation: 10,000m and 5,000m
By Scott Olberding (@isthatsol)
Grit. Determination. Killer-instinct. Guts. Superlatives and hyperbole accompany championship events year-in and year-out, seemingly as integral to the match/game/race as the athletes themselves. However, as analysts are beginning to show, a driving factor in these dizzying performances is often overlooked and unspoken of: efficiency.
Take for instance the meteoric rise of the Bay Area’s favorite child, Stephen Curry. Much has been written and orated regarding his uncanny ability to make shots when it counts, and specifically that his shot efficiency is the catalyst of his greatness. One of my favorite graphics on this topic is curated by Kirk Goldsberry, showing every shot taken over the course of a season. His chart has assigned color gradients, which display relative efficiency compared to the rest of the NBA. You can see the chart here.
Taking a similar approach to track & field, and more specifically the distance events, I wondered if a similar trend occurred. Rather than analyzing data over the course of the entire track season, I decided to look at historical Division I NCAA Track & Field Preliminary and Championship qualifiers and examine how many athletes from that respective school had to race to produce a qualifier. In other words, if an athlete from a specific school races a 5,000m or 10,000m race during the season, how often did it result in a performance that qualified for NCAA preliminaries, and next, how often did that preliminary race result in a national qualification? After all, with respect to scoring points at nationals, qualifying is a pretty important step.
The method applied was to examine the top-500 performances in both the 5,000m and 10,000m for each year from 2010 through 2015 and calculate how many of those resulted in a preliminary qualifier on a school-by-school basis. Then, I looked at how many of those preliminary qualifiers in turn qualified for nationals. This would tell us which programs are not “wasting” races that do not eventually result in a nationals appearance. This statistical exercise resulted in a total of 279 unique colleges and 6,000 race performances. The following chart shows the results for the 5,000 meter event, with the usual suspects occupying the upper-right corner:

Please also note that the size of each school’s dot has been scaled relative to the number of national qualifiers produced of the 2010-2015 period. For instance, the smallest dots represent one athlete, while the largest dot (University of Oregon), represents 13 qualifying athletes. Over this time period, there were only five schools that met this criteria: 1) qualifying at least 40% of their racers to preliminaries, 2) qualifying at least 40% of those athletes on to nationals, and 3) qualifying at least 5 athletes in total to nationals. These schools are North Carolina State, Stanford, Oregon, Arizona, and Oklahoma State.
A similar and more polarized trend exists in the 10,000m. Below is the chart showing efficiency for men competing in the 25-lap endeavor:
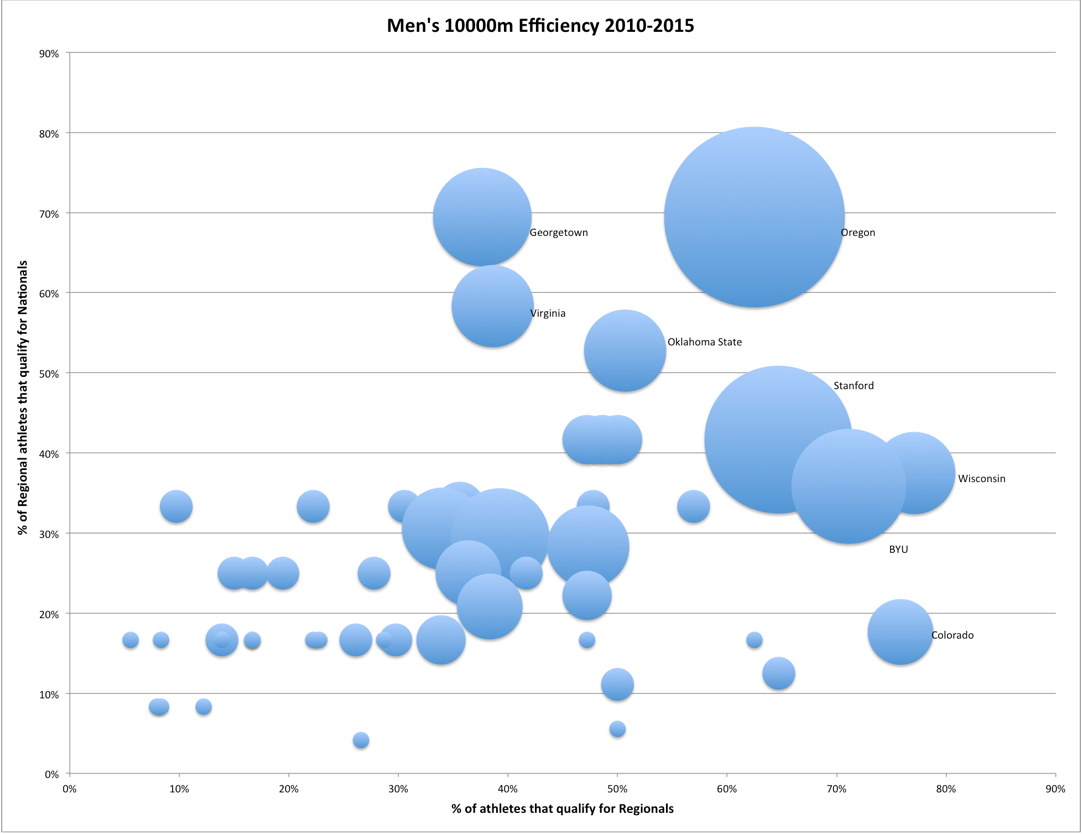
For the 10,000m, six schools meet the same efficiency criterion that was outlined above. These programs are as follows: Louisville, Southern Utah, Arizona, Stanford, Oklahoma State, and Oregon. Between these two charts, we can see that not only is the University of Oregon efficient; they are also prolific. From 2010 to 2015, they have qualified to nationals a combined twenty-four athletes between the 5,000 and 10,000.
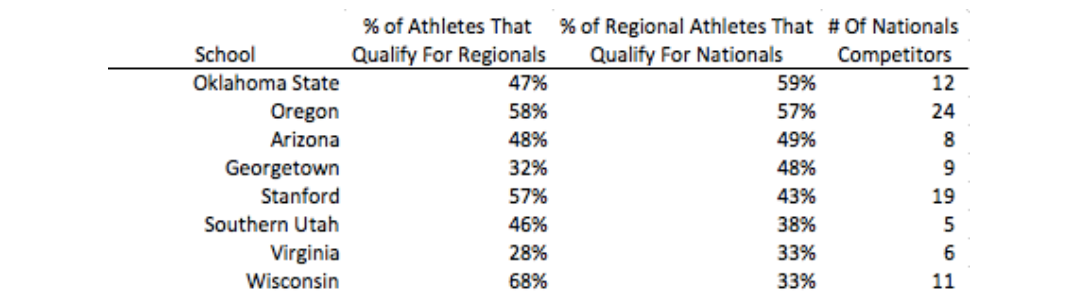
To paint an aggregated picture of both events, the following chart shows the above figures combined. Here, we are able to see which distance programs offer the highest level of efficiency:

Unsurprisingly, the University of Oregon places itself as the most upper-right point. Here is a tabular display of the most efficient distance programs between 2010 and 2015, serving as a who’s-who of men’s distance dominance:
As athletes, coaches, spectators, and media descend on Eugene, Oregon this week for the Division I Track & Field Championships, much will be said of the efforts on display. At play for the top-contributing distance programs is a tool that has been honed for the past several months if not years: efficiency. And if the past is any indication of the future, this year’s distance races will showcase some of the most proficient and economical in the game.