2016 U.S. Olympic Team Marathon TrialsFeb 10, 2016 by Taylor Dutch
Marathons, Deviation and Glory: A Statistical Look at Trials Performance
Marathons, Deviation and Glory: A Statistical Look at Trials Performance
By Scott Olberding (@isthatsol)In mid-February, long distance running enthusiasts get a taste of the Olympic Games even while grounds-keepers are still layi
By Scott Olberding (@isthatsol)
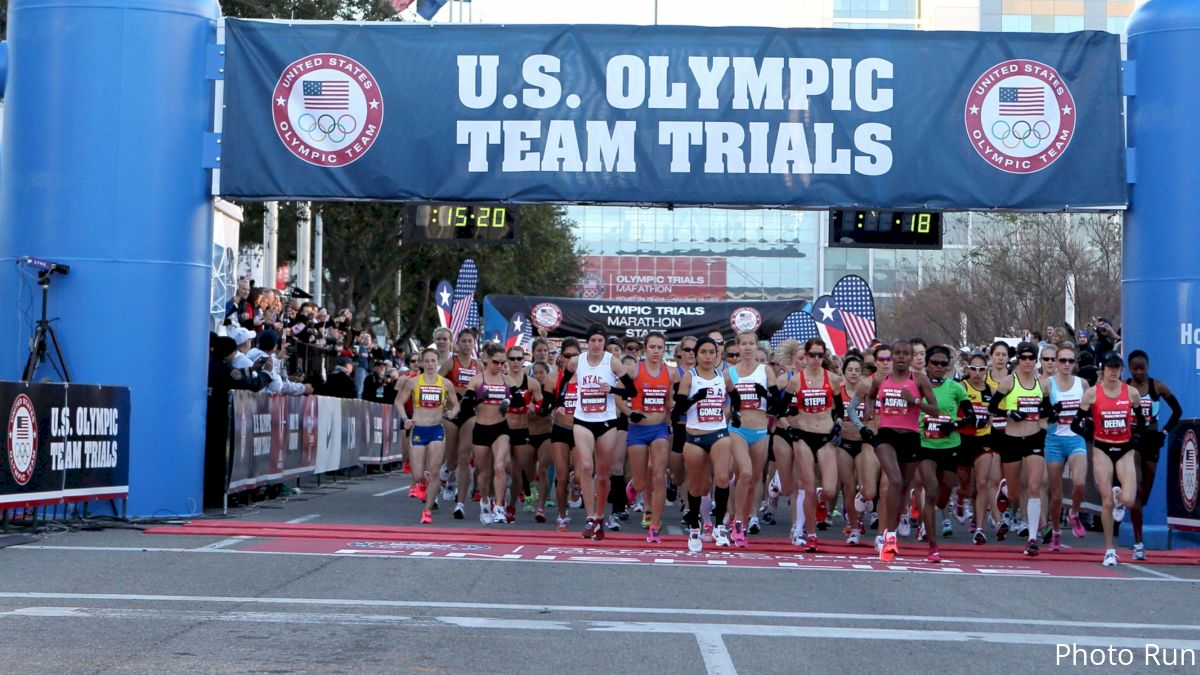
In mid-February, long distance running enthusiasts get a taste of the Olympic Games even while grounds-keepers are still laying the turf in Rio de Janeiro. For about two and a half hours, American athletes will do their best to move forward through space-time on the closed streets of Los Angeles, California in an effort to be one of the first three to travel a little over 26 miles. Not a problem. A lot of these people in the race do this for a living. In fact, twenty-six miles is a little more than the driving distance from Newark Liberty International Airport to Yankee Stadium in the Bronx. On a global scale, a marathon involves a very insignificant amount of both time and space.
Even considering the above, remarkable things happen in marathons. For instance, examining the data below, things can really fall apart after the first twenty miles. The below graph shows the mile-by-mile deviation relative to each athlete’s average mile time for the women’s 2012 Olympic Trials in Houston, Texas:
>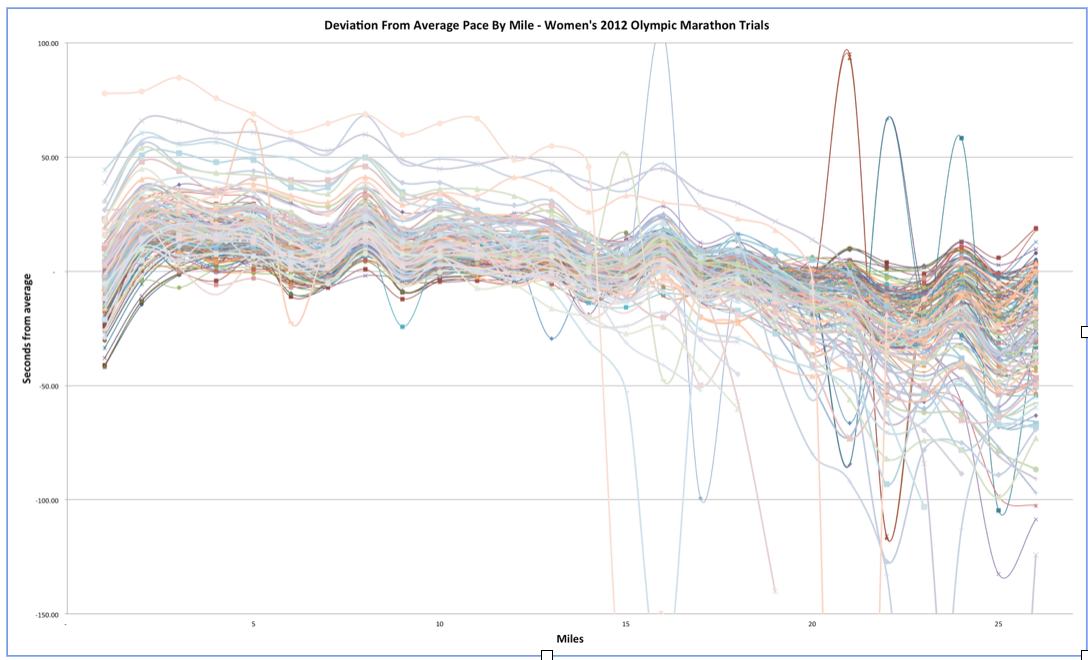
As illustrated in the above chart, things really start to get interesting around mile 20 (i.e. things fall apart). As you might be able to imagine, the athletes that finish the highest have the least degree of deviation from their average time. That is to say, run consistent times (and run fast), and the race will take care of itself. Here is the same chart, but for the women’s 2008 U.S. Olympic Trials, which took place in Boston, Massachusetts:
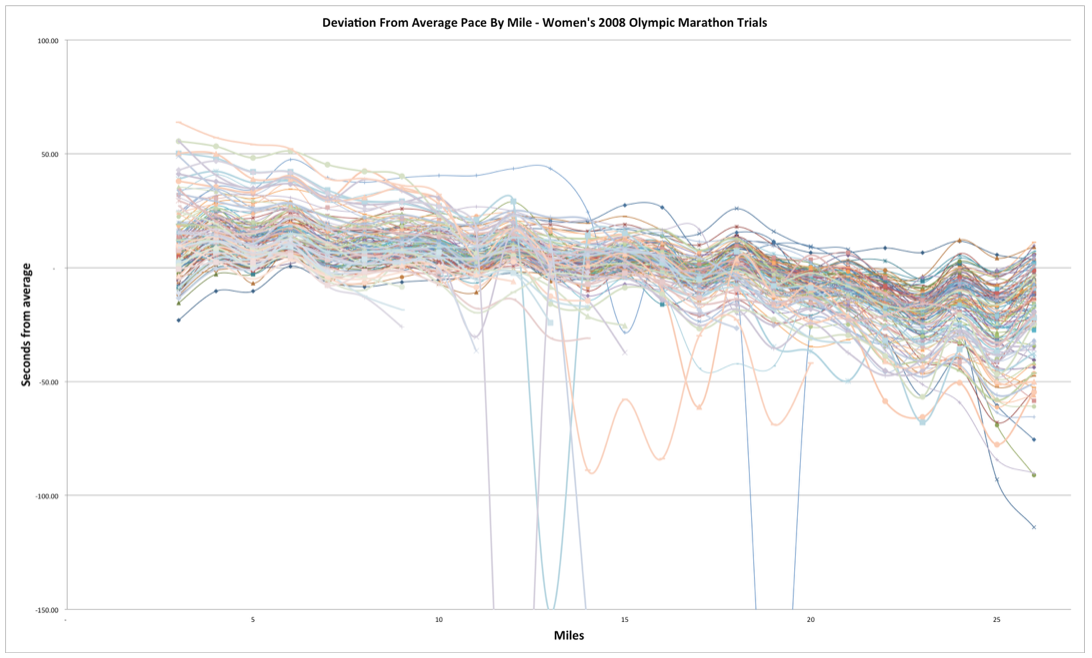
This graph paints a slightly less painful picture, with athletes running a slightly tighter band.
Taking a closer look at the top athletes, we see that they run fairly consistently over the course. Here is the above graph but isolated for the top five finishers for 2008 and 2012, respectively:
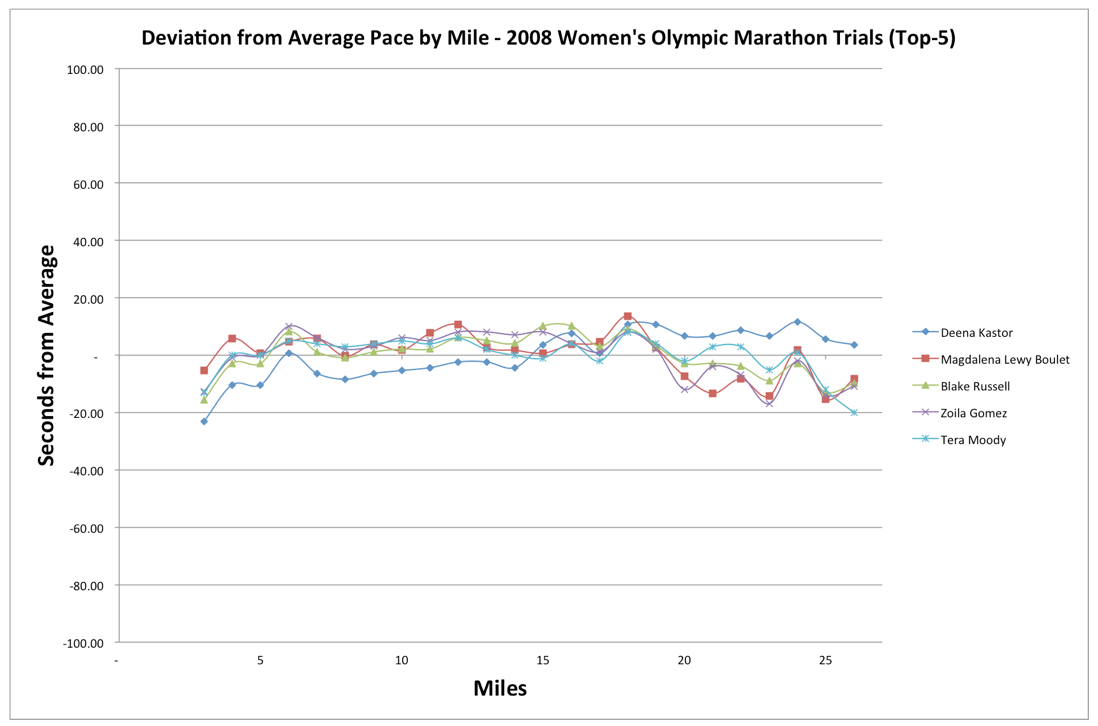
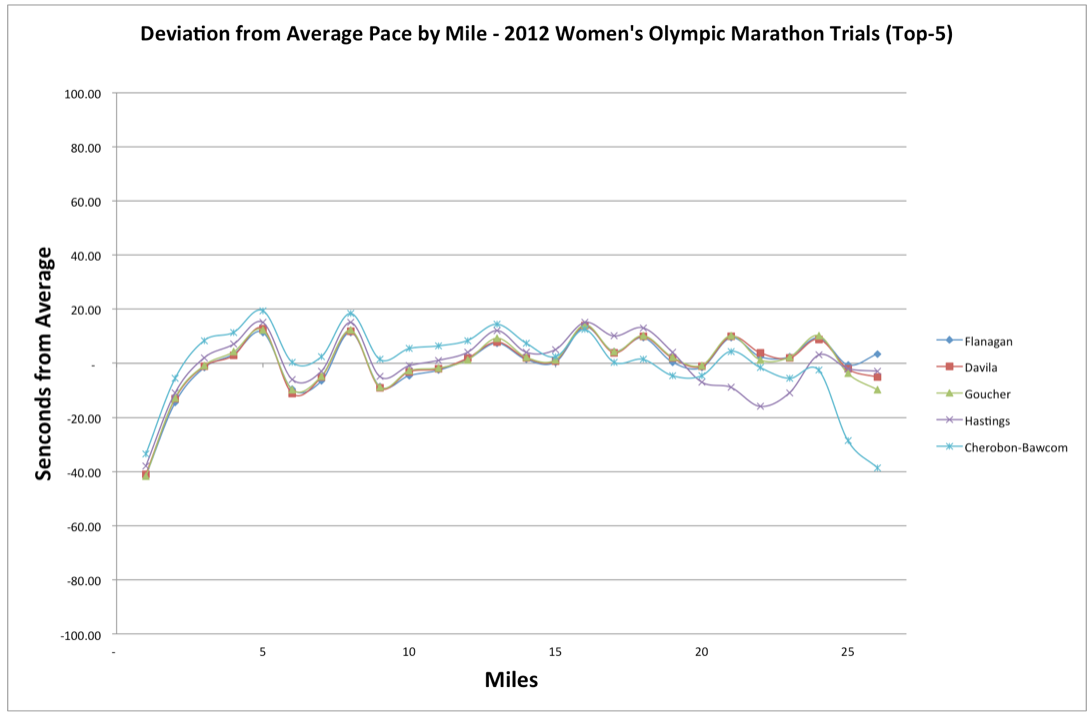
These are pretty boring charts because fast people run relatively boring marathons with respect to their mile-to-mile pace.
Another perspective to examine the idea that the top athletes run much more consistently over the course would be to take a look at their finish place relative to the standard deviation of all their respective miles they ran. In doing so for the 2012 women’s Trials, we get the following graph:
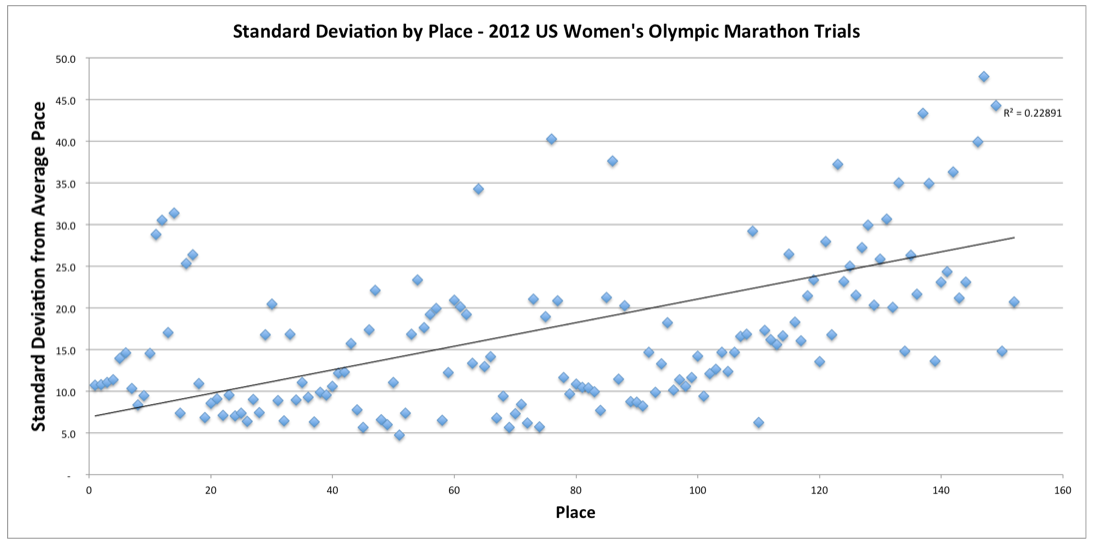
For the 2012 women’s race, deviation from each athlete’s average time seems to correlate loosely with place.
When it comes to blowing up in the marathon, though, the women’s race typically can’t hold a candle to the men’s race:
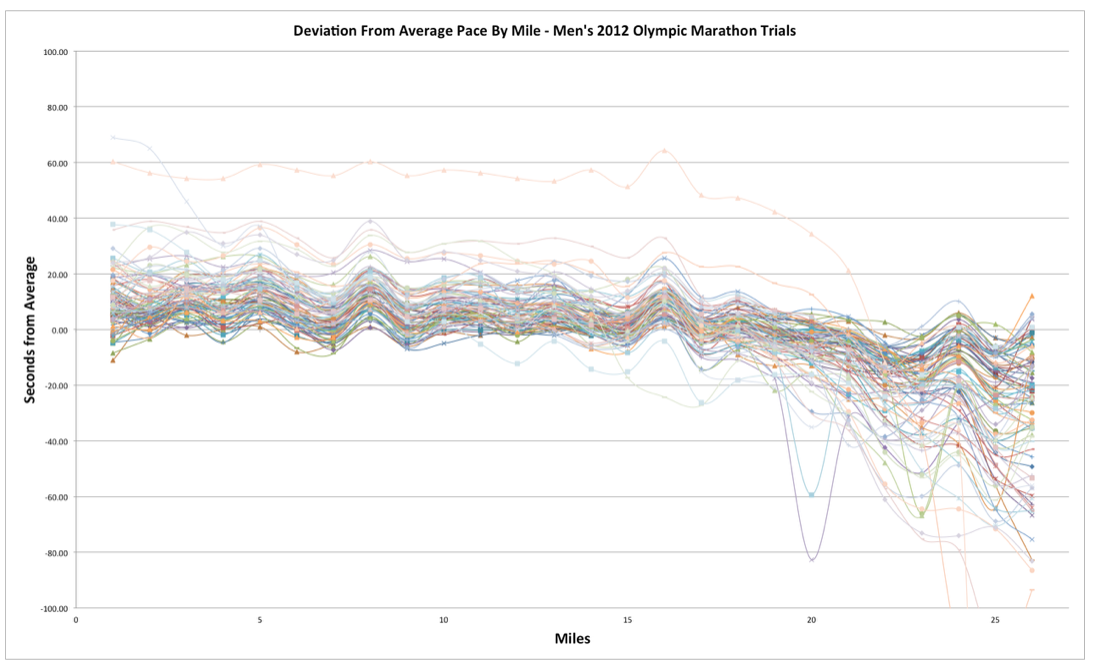
You can practically see the pain in the scatter chart.
Historically, the men’s race has been much more consistent until the last six miles, which is where the fireworks really start to go off in terms of statistical variation. It seems as if the women’s race has a much more consistent flow for the entirety of the field, with a broader band of variation, whereas the men are seemingly more determined to reduce early variation and most pay for it later in the race.
Here is the same chart showing the 2012 men’s race mile variation by place:
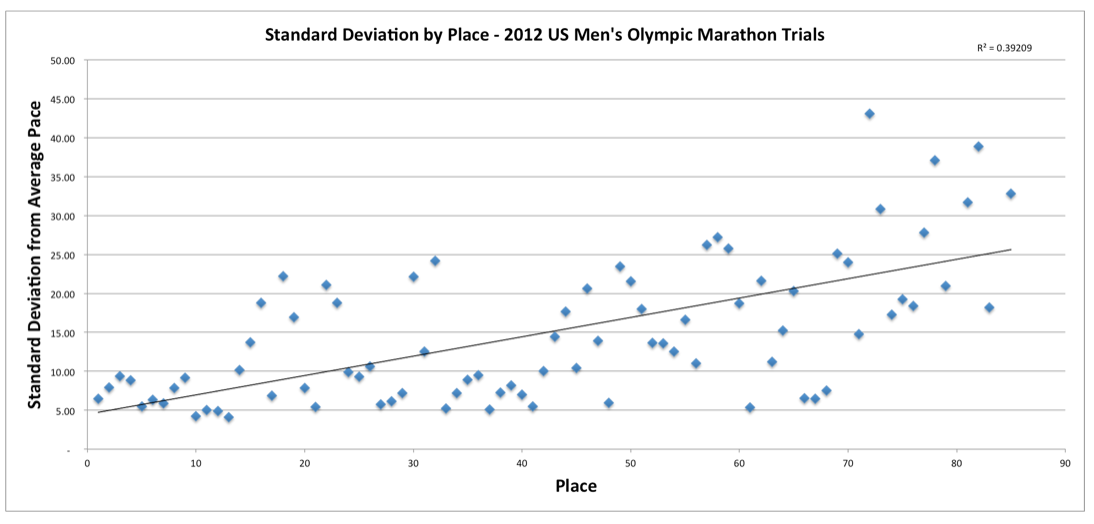
Based on the above, we can see that the R2, is higher for the men’s race, a 0.39 compared to the women’s 0.23. This means that more of the variation in pace can be explained by the place in the men’s race when compared to the women’s. In this instance, I would infer this to suggest that at least in 2012, the men’s race was run at a more break-neck pace for the majority of the runners, causing them to hit a point of no return, breaking and slowing down relative to their average pace.
In light of all the statistics presented, the 2016 U.S. Olympic Marathon Trials will undoubtedly prove to be an exercise in patience, pain, and for a certain few athletes, glory. As our runners ebb and flow past the Staples Center, down Figueroa Street, towards the University of Southern California and back again, time will certainly be at play, but ultimately, aerobic marvel will present to us our Olympic guild to send to Brazil.
The Olympic Trials Marathon will be live on NBC.
In mid-February, long distance running enthusiasts get a taste of the Olympic Games even while grounds-keepers are still laying the turf in Rio de Janeiro. For about two and a half hours, American athletes will do their best to move forward through space-time on the closed streets of Los Angeles, California in an effort to be one of the first three to travel a little over 26 miles. Not a problem. A lot of these people in the race do this for a living. In fact, twenty-six miles is a little more than the driving distance from Newark Liberty International Airport to Yankee Stadium in the Bronx. On a global scale, a marathon involves a very insignificant amount of both time and space.
Even considering the above, remarkable things happen in marathons. For instance, examining the data below, things can really fall apart after the first twenty miles. The below graph shows the mile-by-mile deviation relative to each athlete’s average mile time for the women’s 2012 Olympic Trials in Houston, Texas:
>

As illustrated in the above chart, things really start to get interesting around mile 20 (i.e. things fall apart). As you might be able to imagine, the athletes that finish the highest have the least degree of deviation from their average time. That is to say, run consistent times (and run fast), and the race will take care of itself. Here is the same chart, but for the women’s 2008 U.S. Olympic Trials, which took place in Boston, Massachusetts:

This graph paints a slightly less painful picture, with athletes running a slightly tighter band.
Taking a closer look at the top athletes, we see that they run fairly consistently over the course. Here is the above graph but isolated for the top five finishers for 2008 and 2012, respectively:


These are pretty boring charts because fast people run relatively boring marathons with respect to their mile-to-mile pace.
Another perspective to examine the idea that the top athletes run much more consistently over the course would be to take a look at their finish place relative to the standard deviation of all their respective miles they ran. In doing so for the 2012 women’s Trials, we get the following graph:

For the 2012 women’s race, deviation from each athlete’s average time seems to correlate loosely with place.
When it comes to blowing up in the marathon, though, the women’s race typically can’t hold a candle to the men’s race:

You can practically see the pain in the scatter chart.
Historically, the men’s race has been much more consistent until the last six miles, which is where the fireworks really start to go off in terms of statistical variation. It seems as if the women’s race has a much more consistent flow for the entirety of the field, with a broader band of variation, whereas the men are seemingly more determined to reduce early variation and most pay for it later in the race.
Here is the same chart showing the 2012 men’s race mile variation by place:

Based on the above, we can see that the R2, is higher for the men’s race, a 0.39 compared to the women’s 0.23. This means that more of the variation in pace can be explained by the place in the men’s race when compared to the women’s. In this instance, I would infer this to suggest that at least in 2012, the men’s race was run at a more break-neck pace for the majority of the runners, causing them to hit a point of no return, breaking and slowing down relative to their average pace.
In light of all the statistics presented, the 2016 U.S. Olympic Marathon Trials will undoubtedly prove to be an exercise in patience, pain, and for a certain few athletes, glory. As our runners ebb and flow past the Staples Center, down Figueroa Street, towards the University of Southern California and back again, time will certainly be at play, but ultimately, aerobic marvel will present to us our Olympic guild to send to Brazil.
The Olympic Trials Marathon will be live on NBC.
Related Content
 Penn Relays 2024 Results On Day 2: See Which NCAA Stars Won
Apr 26, 2024
 Penn Relays 2024 Schedule Day 2: Here Are Today's Events
Apr 26, 2024
 Jette Beermann Pushes To Win Women's 5000M Competition At Penn Relays
Apr 26, 2024
 North Carolina Track And Field Stars Win At Penn Relays Year After Wreck
Apr 26, 2024
 Tim Jordan Speaks About Rekortan, The World's Most Certified Tracks
Apr 26, 2024
 Collin Gilstrap Bursts From Fifth To Win College Men's 1500M At Penn Relays
Apr 25, 2024
 Sha'Carri Richardson, Christian Coleman Set For Wanda DL Shanghai/Suzhou
Apr 25, 2024
 Penn Relays Location Is Also The Home To The Best Cheesesteaks In America
Apr 25, 2024
 Pro Men's 4x100m Relay Special Olympics, Event 116, Finals 1
Apr 25, 2024